
JVM GC tuning is a vast field that books have been written about. Mostly, we’re happy to accept whatever defaults the JVM figures out, at most cranking up heap and permGen size when we’re out of memory (again).
I’ve found that with the ScalaIDE plugin installed, Eclipse was so memory-heavy and often still sluggish that I’ve spent some time tuning. Why?
Besides the fact that a glorified Texteditor with a compiler attached needs gigabytes of memory, the darned thing was still slow, often becoming unresponsive for some seconds. This sucks.
The defaults
The JVM settings live in Eclipse’s ini file, which you get to visit fairly quickly to crank up the 512M heap to 1G as recommended by the Scala plugin, ending up with this:
-XX:MaxPermSize=256m

-Xms40m

-Xmx1g
That didn’t work so well…
After a couple of minutes, the IDE locks up. A quick look at the JVM memory, using JVisualVM (part of the JDK), tells us why:
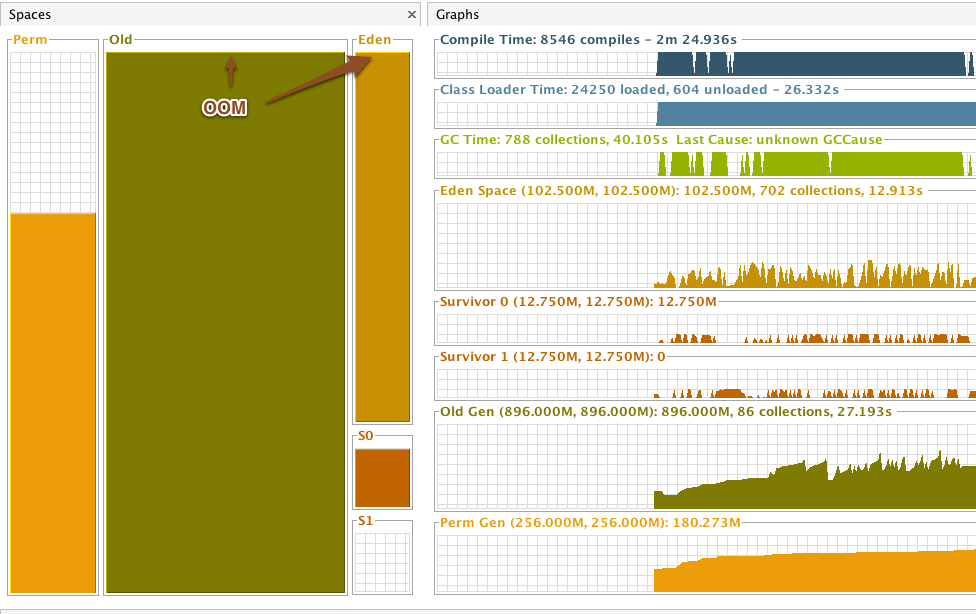
That didn’t take long. Ok, so 1GB heap doesn’t get us very far. But hey, memory is cheap, so let’s give it 3GB and also up the perm a little, since that’s on an upwards curve as well.
Memory fatpants
-XX:MaxPermSize=320m

-Xms40m

-Xmx3g
So, let’s do this again. The project I’m using has 12 modules by now, of which some depend on others, so there’s a fair bit of compilation that triggers compilation going on.
Now I’m not doing anything special here, just editing source, using the autocompleter, etc.
The IDE is still slow to interact with, having frequent pauses and generally feeling sluggish to the point that things you type take a bit of time to actually appear, just as if I was actually remote-controlling another machine. Now it could be that it’s simply a crappy application, but let’s take another look at the JVM and see what the “memory fatpants” have done for us:
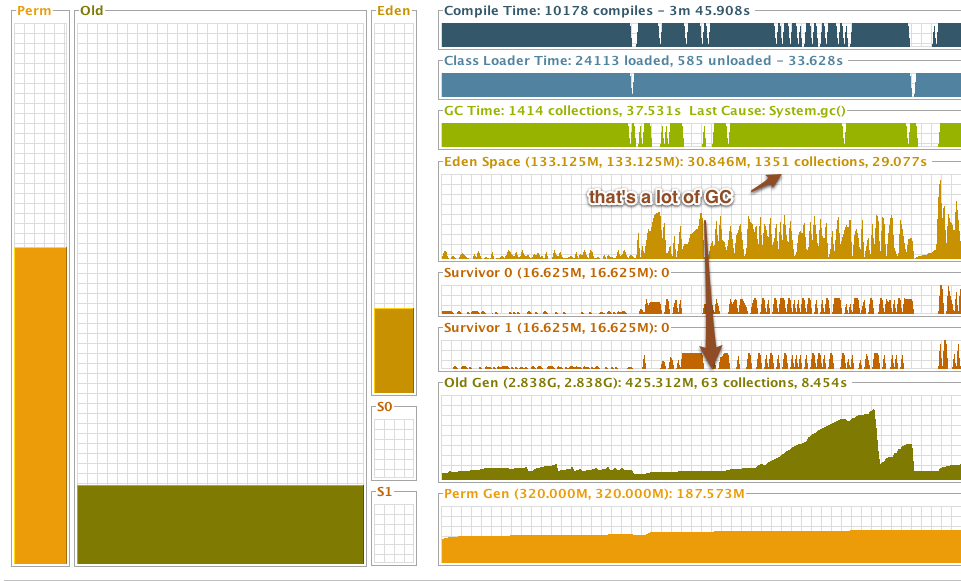
Nearly all the memory went to the old generation, and eden is just getting hammered with minor GCs. From the actual usage of the old gen we can see that there aren’t that many long-lived objects around, it’s just young overflowing. Old gen full GCs are way more expensive than young gen GCs, so we usually don’t want that to happen.
A quick look at JConsole (also part of the JDK) tells us that we’re actually running the CMS (ConcurrentMarkSweep) GC:
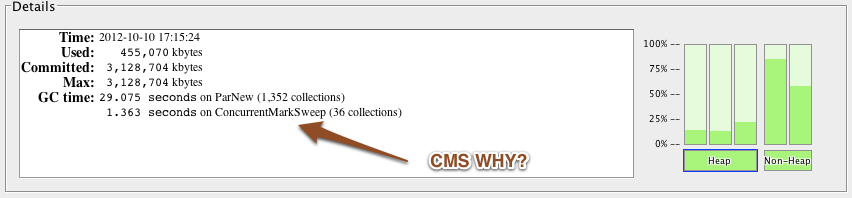
This is due to some odd things Apple has done the the JVM: Mac OSX Java HotSpot VM is client by default and uses CMS.
So next step of action: Increase new ratio, switch to server JVM
That’s what I thought I had all along…
-server

-XX:MaxPermSize=320m

-XX:+UseParallelGC

-Xmx3g

-Xmn2g
I’m now enforcing a large new generation and switched the garbage collector from CMS (which would constantly churn on old) to parallel GC. Time to test again.
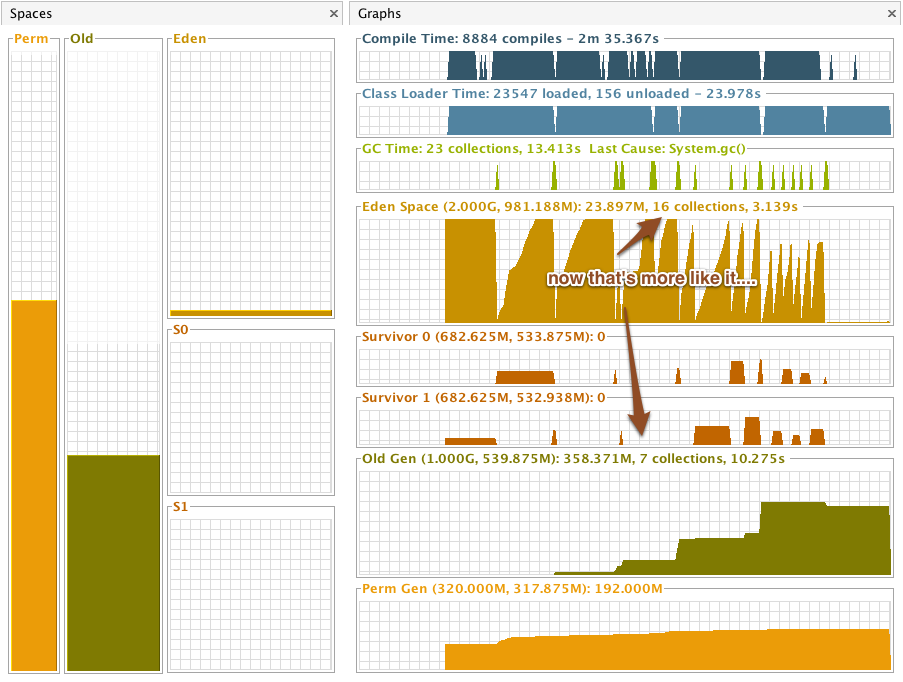
That’s better. We’ve gone down from 1000+ minor GCs to 16, with the time spent on minor GC reduced by order of magnitude. The old gen GCs take longer, but they’re far less frequent, so less disturbance in my interactions.
One last thing…
Did you see that:
Last Cause: System.gc()
I for sure didn’t press the button, so somewhere either in Eclipse or in the Scala IDE plugin there’s an explicit system.gc call.
Probably someone left a comment next to it “// for performance, don’t remove” or something. If you observe it, you’ll see that it happens every minute.
Fortunately, there’s a JVM parameter against such foolishness:
-XX:+DisableExplicitGC