
 This post is part of our collection on product management. Learn best practices and get advice from Atlassian’s product managers here.
As product managers, we take every opportunity we get to learn more about our customers because understanding their needs is critical to building and releasing useful products. This means conducting customer interviews, running surveys, and examining in-product analytics. The data we glean from product analytics tell us how users actually use the product – not what they want to do or how they think they’re using them.
“How much time do users spend in the product each day?” “What actions do they take most?” “Which features get used least?” These types of insights are incredibly valuable for understanding your users and give clues as to how to make their experience better. In this post, I’ll explain what product analytics are and why you should use them; how to gain a true understanding of your users so you can pay off “empathy debt”; and how to use analytics to help guide new feature development.
Let’s get started!
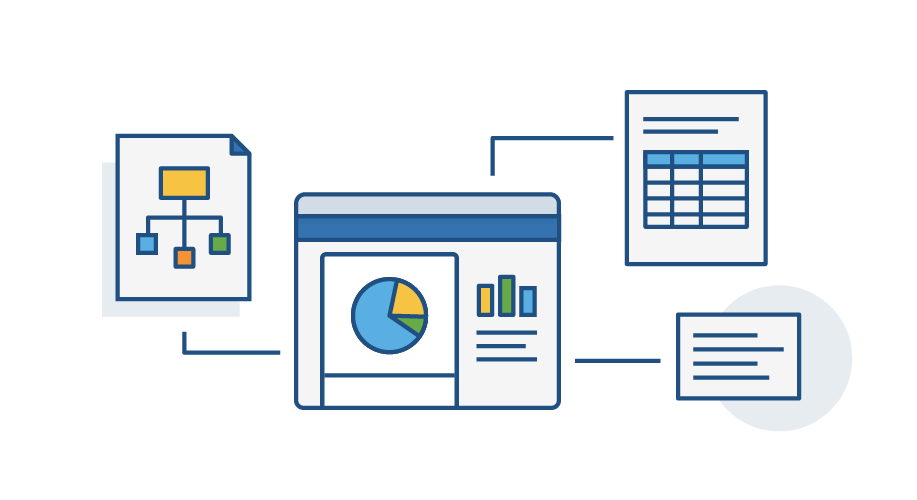
An intro to product analytics
In order to get a quantitative understanding of what users are doing with your product, the first step is instrumenting it with analytics. The idea is to fire an event for every action that a user can take in your product so you get an aggregated view of how many users use a feature, and how often they’re using it. From there you can see which features need work, which are your most important, and use that information to prioritise changes. (There’s a great blog post over at Intercom about this.)

Adding analytics generally involves adding a line of code here and there to fire an event when a user performs an action in your product. For example, if you want to track the number of times a user clicks a specific button, you might fire an event called “big-red-button.click”.
ProTip: There are a ton of solutions out there that give you a framework for adding analytics events and tracking them. Check out Google Analytics or KISSmetrics as a starting point.
At Atlassian we’ve tried to make it as easy as possible for everyone to get at analytics data (anonymized, of course) and be able to run their own queries and reports. We use some internally developed tools to provide these services, but tools Google Analytics will get you started too. This has lead to everyone, from developers to PMs to design, asking questions about usage and trying to understand the impact of what we build.
There are two primary ways that I see analytics being used at Atlassian today, and I’ll dive into an example of each with some examples from my time on Confluence.
“Empathy debt”: the newest kind of debt
Lets try out this new term, “empathy debt”.
Empathy debt: a gauge of whether you understand your users and how they use your product.
Tweet
//
You can pay it off in two ways: with qualitative feedback gathered through activities like concept testing and customer interviews; and with quantitative data collected in-product with things like product analytics and NPS surveys.
As an example, Confluence has been around for a fairly long time now and it has a lot of features that have few (or no) analytics. One of those is the dashboard, which is the beginning of most people’s journey with Confluence, and which we are in the process of overhauling right now. We had some feedback about the dashboard from customer interviews, but we didn’t have all the product analytics needed to really understand usage from a quantitative perspective. We had a lot of unanswered questions, like:
- How much usage does the dashboard get? How many times do people visit the dashboard in a typical Confluence session?
- What do people actually use the dashboard for? The All Updates feed? The Popular feed? Navigating to a space?
- What do people want on the dashboard? Can we determine the best things to surface based on what people do after visiting the dashboard?
These are some pretty fundamental questions that we needed answers to before embarking on a change to one of the most visited pages in Confluence. If you don’t have analytics in your product, or even a specific feature you’re looking to change, then you’re in the same boat and should be very wary about making any decisions. It’s time to pay off that empathy debt!
Pay off your empathy debt as soon as you can – if you don’t have analytics in your product, add them ASAP and start using data to help inform your product decisions. Otherwise you’re making important decisions in the dark. And remember that analytics don’t lie! They show us exactly what users are doing with the product, but try and dig a bit deeper and use analytics to understand what users really want.
Just don’t forget to listen to your users, too
As I mentioned above, it’s great to be data-informed, but being entirely data-driven can sometimes leave you blind to the overall experience that you’re creating for users. Being dependent entirely on data can also be a bit crippling when it comes time to make a decision and you don’t have all the data you need.

Product analytics exposes the raw reality of how people use the product, or even a particular feature, but it can be very one-dimensional. Combining what you think you know from product analytics data with qualitative feedback in customer interviews, concept testing workshops, and sparring will give you a more complete picture of what’s happening so you can build the best product possible.
As with all things in product management, getting product analytics right is a process of iteration and continuous improvement. Does your team do cool stuff with product analytics? Drop a comment and tell us about it! And if you’ve found this post useful, please share it with your networks. Let’s all learn together 🙂
If you enjoyed reading this and want to learn more, click the big green button below!