
We need tools that support the speed at which we work. Even a slight wait can throw you off your flow. Have you ever gotten impatient while waiting for, oh… I don’t know… a Confluence page to load? So you pop over to Facebook (just for a sec – seriously!), and after chuckling over some pics of cats in Halloween costumes, you realize twenty minutes has gone by and you’re on a sub-reddit you never knew existed, with no recollection of what you were working on. Not exactly ideal for productivity.
One of our focus areas this year is improving Confluence’s performance so you can stay focused and accomplish more, faster. We crunched the numbers to determine where we could make the biggest gains, set aggressive goals, and have been rolling out the benefits to Confluence Cloud customers along the way. Today I’ll share our progress, and give you a behind the scenes look at how we’ve approached optimizing performance.
Confluence Cloud is 54% faster
Since we began our new focus on performance in January, we’ve been gradually shipping performance improvements to Confluence Cloud customers. All of those enhancements add up to significant increases in speed:
- 54% reduction in page load time overall
- 500% increase in the number of pages that load in less than a second
- 74% reduction in the number of pages that take more than 4 seconds to load

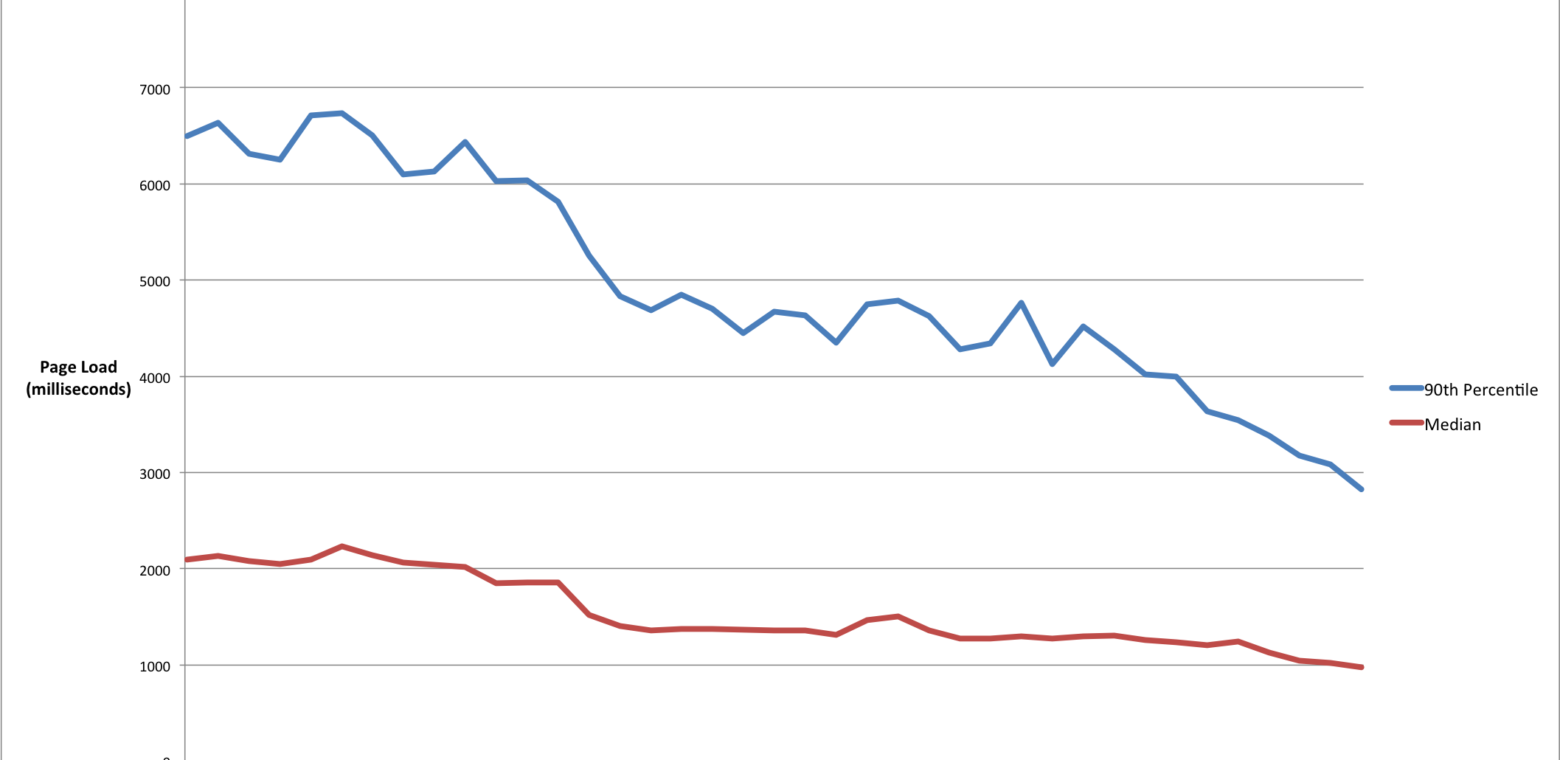
The graph above shows the time it takes for pages to load in Confluence and how that’s changed since January. This is one of those times that down and to the right is actually a good thing ![]() . The blue line represents pages that fall in the 90th percentile, which are the slowest to load, and you’ll notice that gains came in fits and starts as we tackled various aspects of performance. The red line represents the median page load time, which shows a less dramatic reduction, but still a significant decrease from over 2 seconds down below 1 second.
. The blue line represents pages that fall in the 90th percentile, which are the slowest to load, and you’ll notice that gains came in fits and starts as we tackled various aspects of performance. The red line represents the median page load time, which shows a less dramatic reduction, but still a significant decrease from over 2 seconds down below 1 second.
The beauty of Confluence Cloud is that we can ship these performance improvements to customers as they come. You might not notice performance changes from week to week, but over time they add up to the substantial gains in performance shown here.
How we approach Confluence’s performance
Performance is a tricky beast because there are so many factors that affect it, and many of them lay outside of the application itself. The first step is to establish a standard way to measure how the application performs. With that in hand, you can establish a performance baseline, set performance goals for the future, and track progress towards those goals. Fortunately, this is not a new challenge and others have established a standard metric called Apdex to measure the performance of software.
Apdex is a simple calculation that results in a single number you can use for setting goals and tracking performance over time. Apdex assigns points to each user interaction based on your application’s response time, defined as follows:
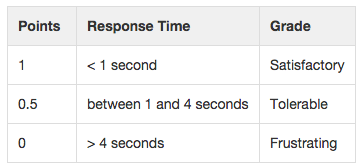
To find an application’s overall Apdex score, you first measure the response times of all pages (or a representative sampling) and assign points to each page according to the table above. You then take the average of all these points to get a single number between 0 and 1. That’s the Apdex score. The closer to 1, the better.
In Confluence, we decided to focus on the time it takes to load a page for viewing because viewing pages represents nearly 90% of all the interactions customers have with our product. Our Apdex score in January 2015 was around 0.45, and we set a goal to reach 0.90. With a lot of hard work over the past ten months, we’re proud to report that we’re over halfway there, with an Apdex score of 0.74 as of October 2015.
A peek under the hood
Establishing a top-level metric and performance goals was really just the first step. Next, we had to figure out what to change within the application to reach those goals. And that meant measuring as much as possible so we could understand where the juiciest opportunities lay. Once we could pinpoint exactly which transactions weren’t performing fast enough, we were able to generate a backlog prioritizing the items that are going to give the biggest performance benefit.
- Page weight – We reduced the amount of JavaScript & CSS in pages by over 40% since last January. The size of our JS & CSS is one of the most significant factors influencing page load performance in Confluence. By reducing the amount of code that needs to be transferred to the browser, we decreased the time it takes to load pages.
- Macros – Macros do wonders to extend the functionality of Confluence pages, but they can also create performance bottlenecks. So we reimplemented several of the most popular Confluence macros, like the Table of Contents macro, for example. Previously the list for the table of contents was generated on the server side, which required re-rendering the page content. We optimized this by reimplementing it on the client side in JavaScript.
- Server Side Caches – Confluence depends on a lot of data and services to display pages. To improve performance we make heavy use of caching to store data Confluence needs to reference often. We re-examined our strategies for refreshing caches to optimize how often we refresh, keeping data balanced with appropriate timeouts so we don’t use too many resources on the server side.
That’s only the surface of what we tackled and how we thought about it.Many thanks to Senior Development Team Lead Brendan McNamara for help gathering the data and for the look into the process. Stay tuned for an upcoming blog series from Brendan and his team on developers.atlassian.com for a deeper dive.
What’s next?
The good news for Confluence Cloud customers is that you’ve already got these upgrades, and you’ll continue to see Confluence performance improve. And never fear, Confluence Server users: you’ll reap the benefits, too. Stay tuned for more details on Server performance upgrades coming in Confluence 5.9.
We’re proud of these performance gains, but we’ve got more work ahead to reach our goal of Apdex 0.90. We’ve focused mainly on the slowest pages and the fastest pages so far, and next up are those pages in the middle that take 1-2 seconds to load. Subscribe to this blog stream for updates on all things Confluence, and follow us on Twitter.