


As a Product Manager (PM) who works within the agile framework, there are several ways of getting customer feedback on my product, such as customer interviews, surveys, and support requests. Another, that you’ve probably also heard of, is NPS.
In case you haven’t, NPS stands for Net Promoter Score. NPS is a loyalty metric that quantifies how customers feel about your product and what you can do about it. This is a particularly valuable customer feedback mechanism for PMs, like myself, who work on products that rely on strong word-of-mouth marketing to spread adoption. The great thing about NPS compared to other quantitative engagement tools like customer satisfaction surveys, is that it’s much, much simpler to rapidly gather feedback that gives a consistent and measurable result. It’s only one question, and the score can be measured against other products.
This article will show you how NPS can be used not just as a metric, but also as a powerful tool to help your software team prioritize features.
A quick NPS primer
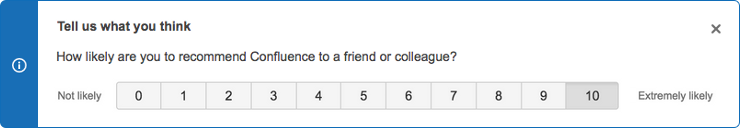
An NPS survey consists of one simple question: “How likely is it that you would recommend <our product> to a friend or colleague?”
This is how it looks in an Atlassian product:
Once you’ve collected a significant number of responses from your NPS survey, you group your responses into three groups: Promoters (9–10), Passives (7–8), and Detractors (0–6).
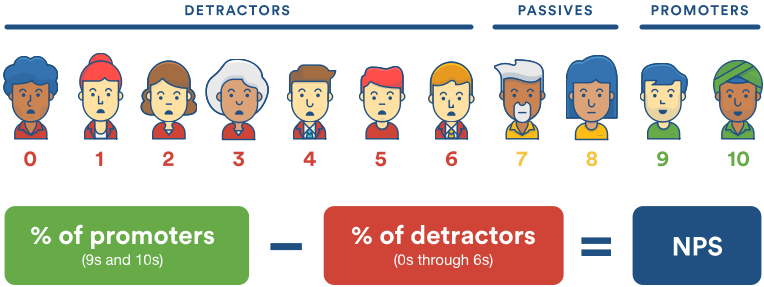
NPS is then calculated by subtracting the % of Detractors from the % of Promoters. For example, if out of 100 respondents, you have 40 promoters, 25 passives, and 35 detractors, your NPS will be (40% – 35%) = +5%. NPS can range from -100% to +100%.
Here at Atlassian, customer feedback guides everything we do. NPS is one of the most important metrics we use to understand how customers feel about our products. But NPS is just a number, it doesn’t tell you why customers are happy or unhappy with your product.
That’s why we ask for feedback once the score is selected:
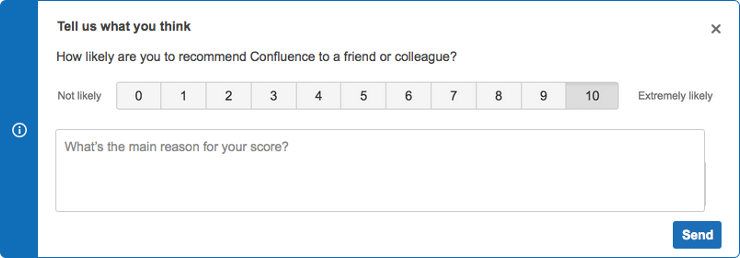
We call these responses “Verbatims” and this is where things get interesting. Here are a couple steps to turn this feedback into actionable insights.
Step 1: Categorize NPS verbatims
We receive thousands of verbatims monthly. To get the most value from all of our customer feedback, we automatically categorize verbatims (using text analytics) into specific themes. This helps us get feedback to the team that can best leverage that feedback.
But, if you’re a product manager that’s identifying specific use cases or pain points, you don’t need to buy, build, or learn any fancy software. You can just as easily read and categorize verbatims on your own.
There’s a ton of value for you and your team in reading and classifying verbatims manually. You’ll quickly gain an appreciation for what makes your customers happy and what makes them miserable. It might even change the way you think about a particular problem or feature.
Let’s look at some examples of verbatims we’ve received about Confluence, and how we use them in our feature prioritization process:
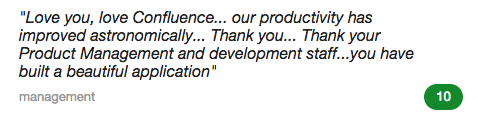
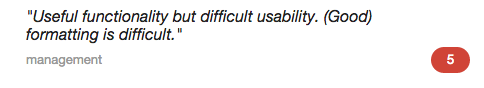
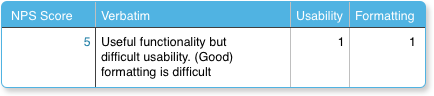
The first verbatim is great to see, but it doesn’t give us any new actionable information. The second verbatim, however, mentions specific customer frustration. We can tag it with “usability” and “formatting” labels. In a spreadsheet (or DB), it can be represented like this:
Let’s look at another one:
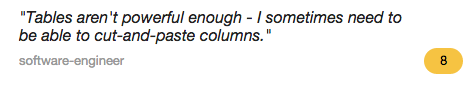
We add the verbatim and two new labels:
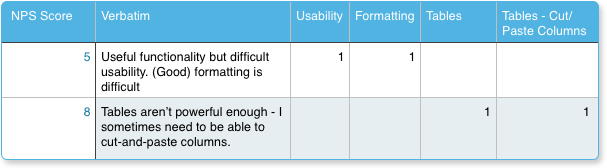
Note that Cut/Paste Columns is a sub-tag of Tables
As we add more verbatims, we can continue to add categories and label them accordingly. As a rule, we do not add labels to feedback that is positive. For example, a verbatim that says “Table features are great! But I wish Confluence was faster” will be tagged with “Performance” but not with “Tables.”
Step 2: Analyzing the results
You’ve classified heaps of verbatims, but how do you know what’s worth working on? At Atlassian, we look at volume and how customers feel (sentiment) when they mention specific experiences. The combination of the two inputs helps us analyze NPS verbatims.
If you’ve chosen to manually categorize, here are some helpful tips to identify the biggest bang for your buck and build a product that customers love.
The first step is counting the number of feedback items in each category.
Let’s say we get:
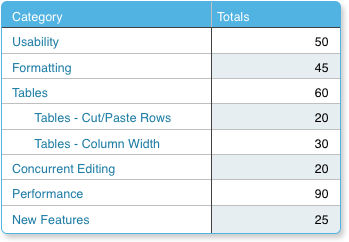
Removing the sub-tags (for now) and reordering, we quickly see our main priorities:
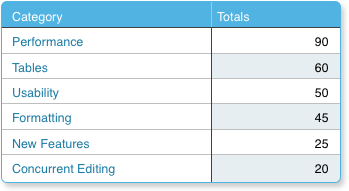
If we had no other information, then it’s immediately clear that Performance is our No. 1 opportunity, as we have the most number of comments mentioning performance. But is it really the most important opportunity to work on? Will tackling performance deliver the most value to the customer?
We can calculate NPS scores for each category to help answer those questions:
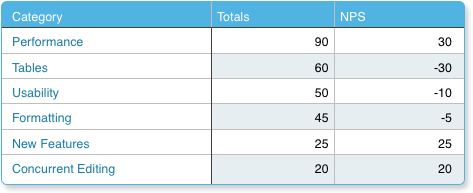
Although many people mentioned performance, the NPS score is relatively high. If we were to focus all our resources on performance, it’s unlikely to make much of a difference to our overall NPS score. Likewise, adding New Features won’t move the needle much. However, it looks like many people are unhappy with the lack of functionality in Tables and are frustrated by poor Usability.
(Side note: Be careful of drawing conclusions when using small sample sizes! The above numbers are only an example and would have a large margin of error.)
Step 3: Let’s get our priorities straight
You’ve classified your verbatims and identified the opportunities with the most impact. Although direct customer feedback is powerful, it’s one input that we should gut check against other customer data (research, product feedback, support contacts, churn feedback, etc.) so that you’re confident that you’re improving the most important experience. You can make a strong case to prioritize these features in your backlog with all of the data, but keep in mind that NPS data will not tell you what to build next – it is one input of many at your disposal.
Now onto the hard part: finding a solution and implementing it.
Good news! You’ve already got a bunch of customer quotes that should help you understand the problem. You might even have customers you can reach out to for interviews via your feature request. Not only does NPS help you prioritize your feature backlog, but the written verbatims help you define the customer problem as well. This combination of a measurable score and customer feedback is pure gold for a PM.
Interested in picking up more PM tips for Confluence?