

This is a guest blog post from Emily Bell of Lucidchart, the maker of Lucidchart for Confluence and Lucidchart diagrams for Jira.
A quick look at the Atlassian marketplace reveals that diagramming tools are some of the most popular add-ons available. There’s a reason for that: complicated tasks and concepts are often better expressed visually. Who wants read walls of text or a tab-filled spreadsheet? In the human brain, visuals are processed 60,000x faster than text, so organizing information in the most digestible way is a huge communication advantage.
But if you’re not a seasoned diagrammer, you may need help getting started. Where do you begin? How do you pick the right diagram for the challenge you want to solve? At Lucidchart, diagramming is our business. Here are some of the best practices we’ve gathered over the years.
1. Know your objective
The first step to building a diagram is to know what you are trying to accomplish with said document. That’s a very broad question, of course, so let’s see if we can break it down a bit. Diagrams are all about ideas. So what do you want to do with your ideas?
Do you want to express ideas?
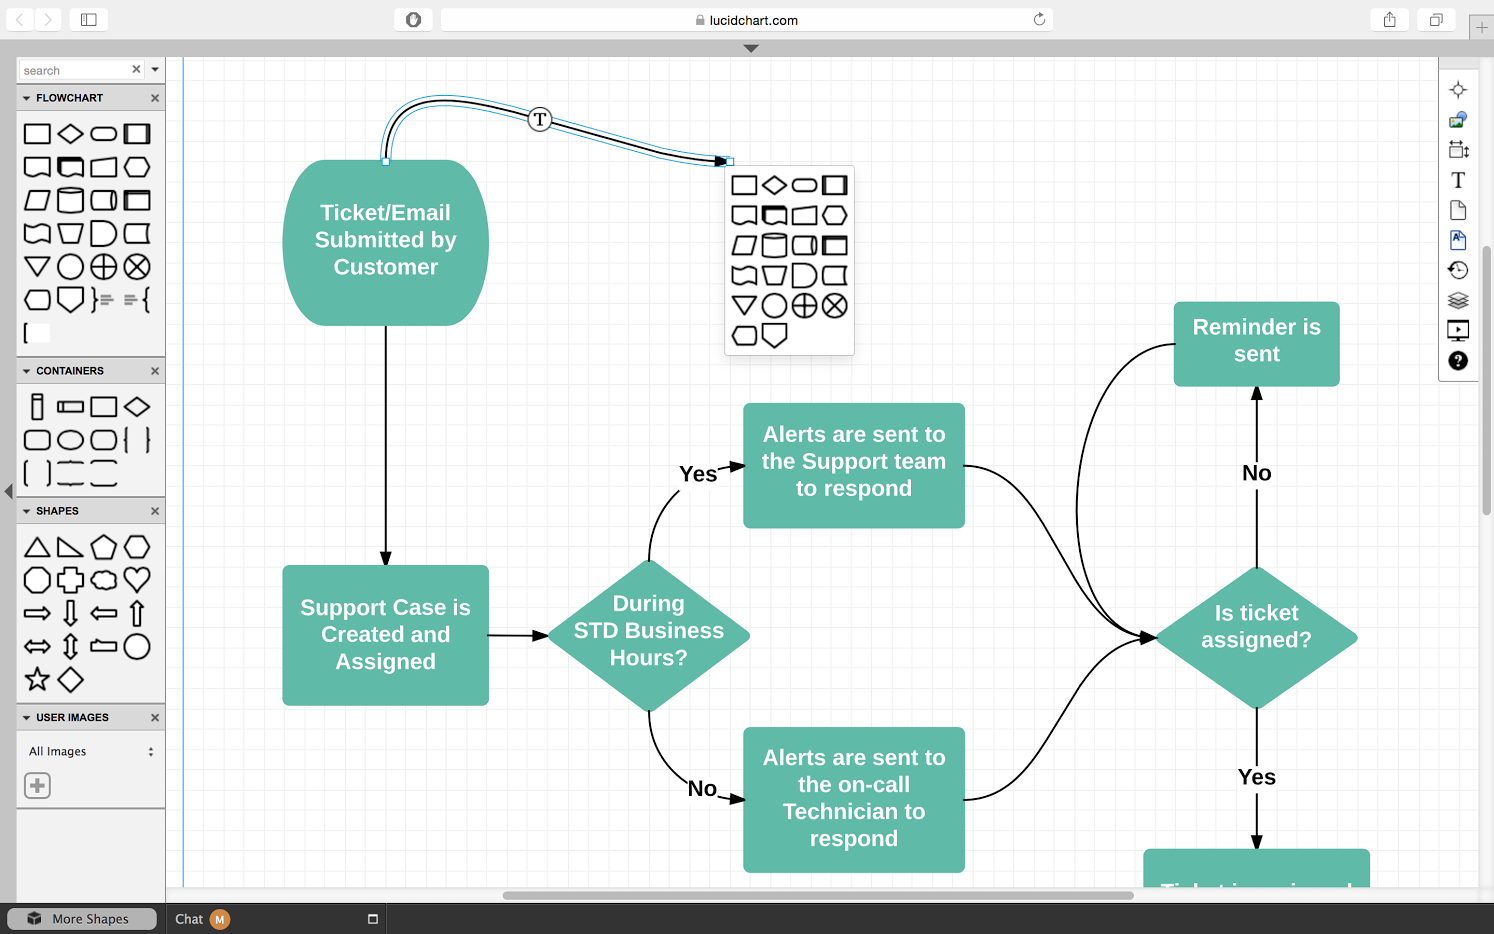
If you’re trying to get a process or flow across to others, you’ll probably need a flowchart. You could list that targeted mailings flow out in steps, but it’s a lot easier to show it. A flowchart can be as simple as three rectangles connected by a line or it can be a complex tree with dozens of steps and decisions. Many popular diagram types actually fall under the overall header of flowchart. For example, Business Process Modelling Notation (BPMN) is perfect for conveying events and activities in a business-specific flow. A swimlane diagram is nice for not only showing what tasks will be completed in what order, but also who will complete them.
Do you want to organize ideas?
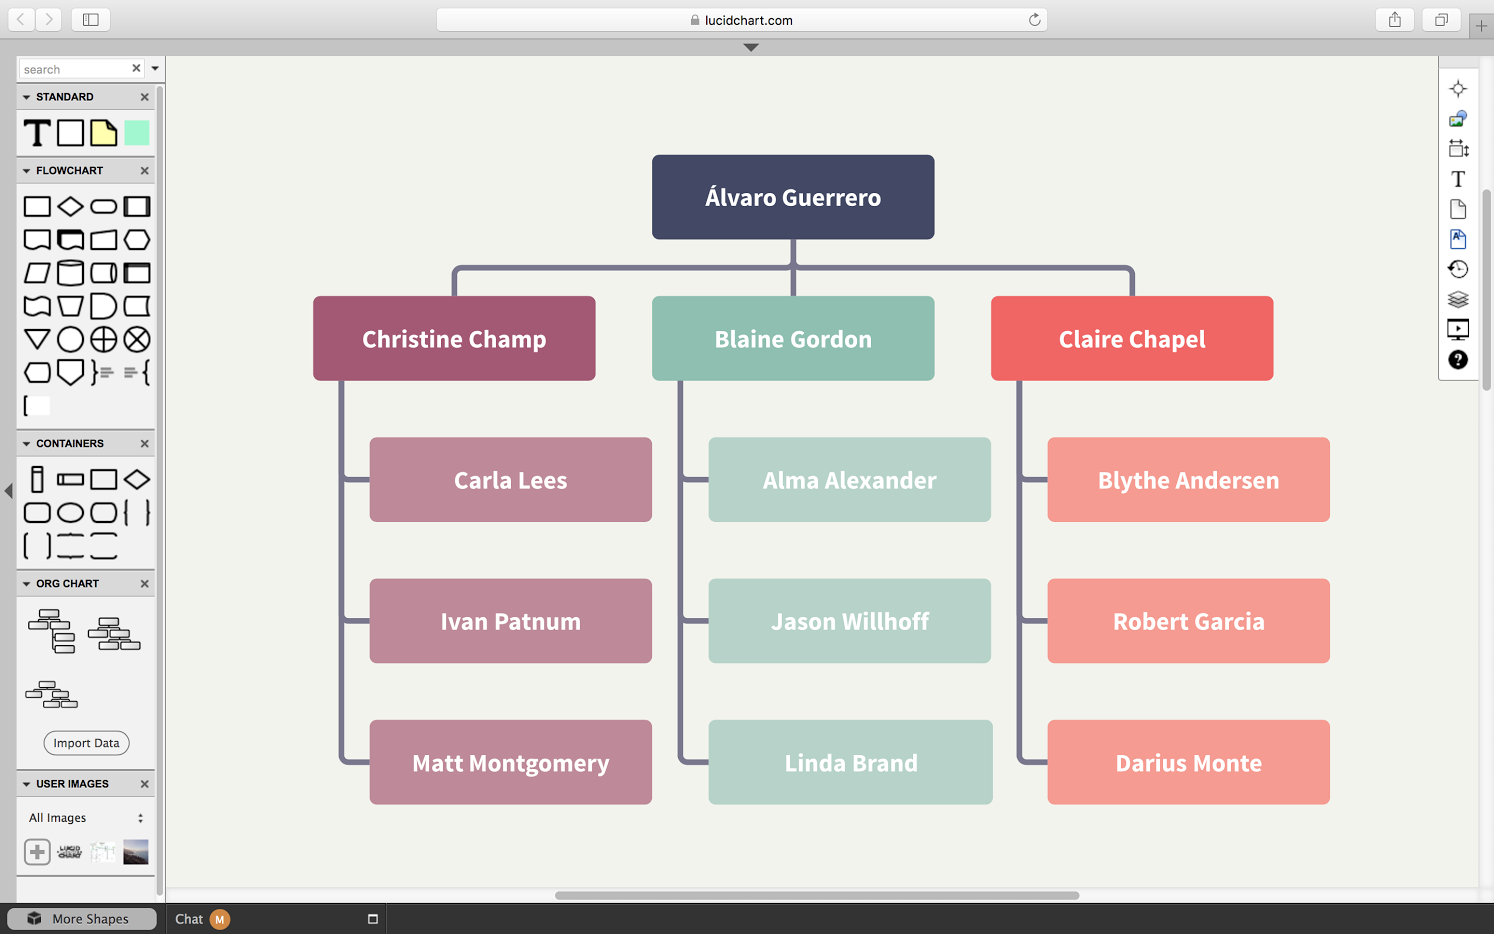
Depending on what you need to organize, there are several different diagrams that might be right for you. If you’re organizing people, whether it’s showing a company hierarchy or your own family tree, you’ll likely need an org chart. However, if you need to lay out the IT plan for you office, go with a network diagram instead. And let’s say you’re organizing your brilliant ideas into a beautiful design. A wireframe can help you sketch out something simple, whereas a mockup will capture a fully built design for an app or webpage.
Do you want to generate ideas?
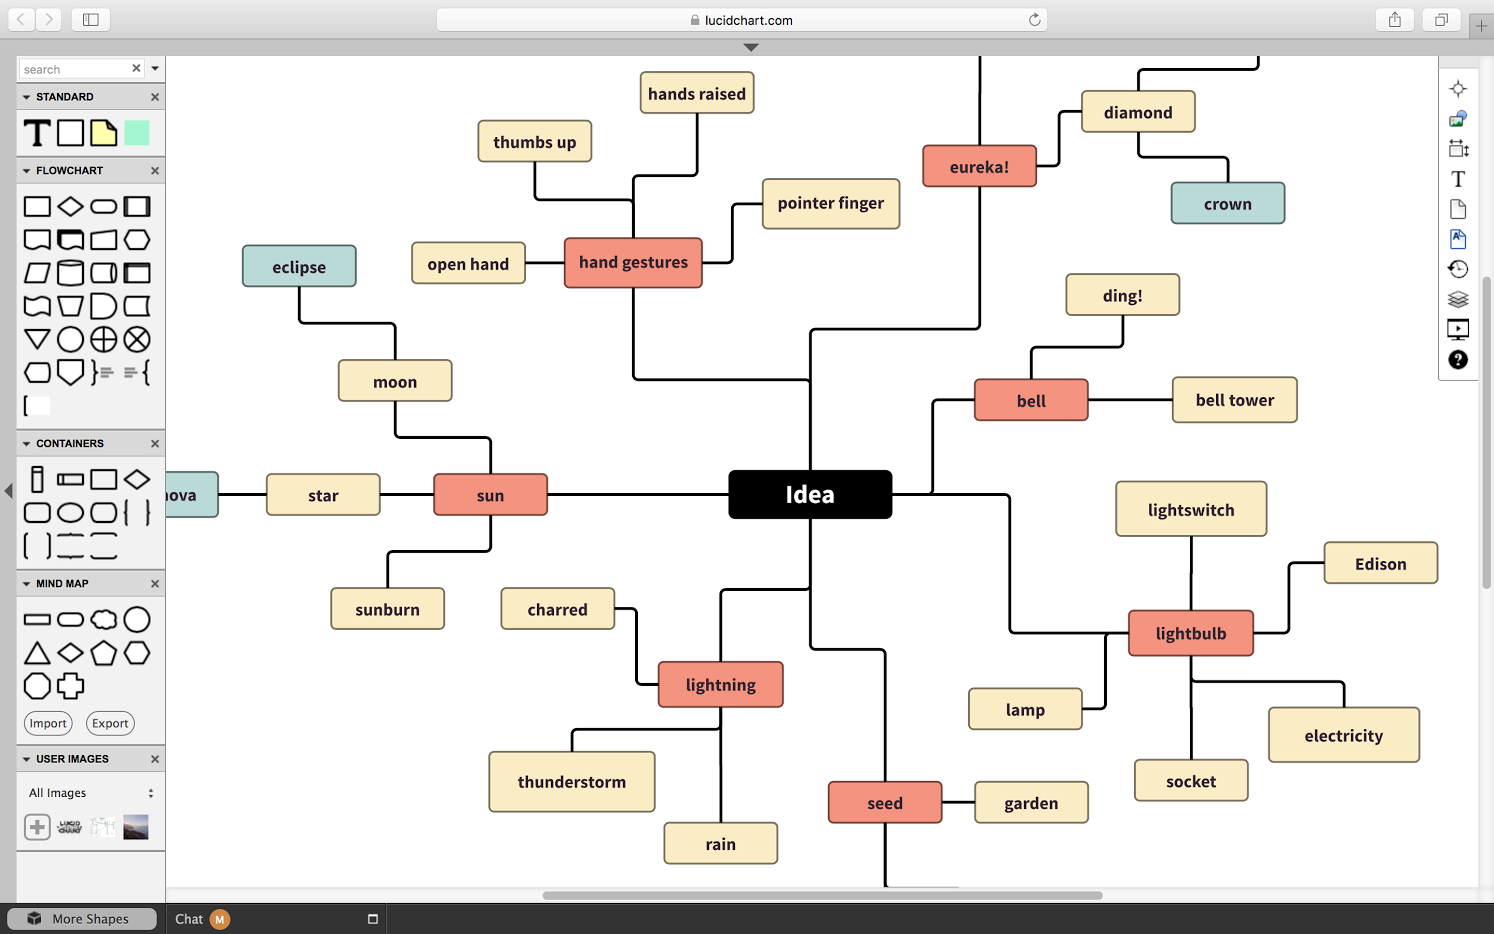
Maybe you don’t even have a good idea yet. In that case, get started with a mind map. It’s a great tool for brainstorming almost anything, from the right way to generate higher cash flow next quarter, to the plot of your new sci-fi novel.
2. Tailor content to your audience
Once you’ve picked a diagram type, it’s time to start building it. And you should build your diagram based on the target audience. This will help you determine the level of complexity you should add, how you should label information, and even the look and feel of your finished piece. For example, a diagram of your server rack will need to be precise and detailed, whereas most Venn diagrams can be put together in minutes. Similarly, a mind map made just for you might look a lot different than an onboarding diagram for the whole company stored in Confluence. One nice addition to add to certain diagrams is branding. Try using company colors and fonts in your diagram.
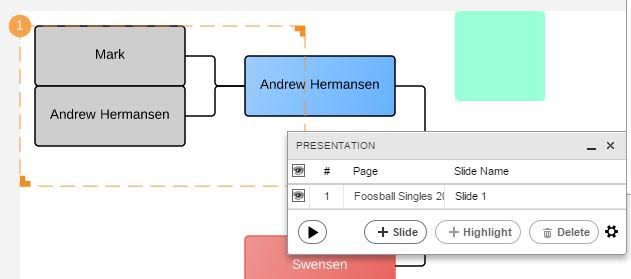
If you’re presenting your diagram to a large audience, consider turning it into a series of slides. Lucidchart has a presentation mode that lets you do just that. You can first show an overview, then move onto a series of slides that show zoomed-in views of key diagram points.
3. Keep it short and sweet
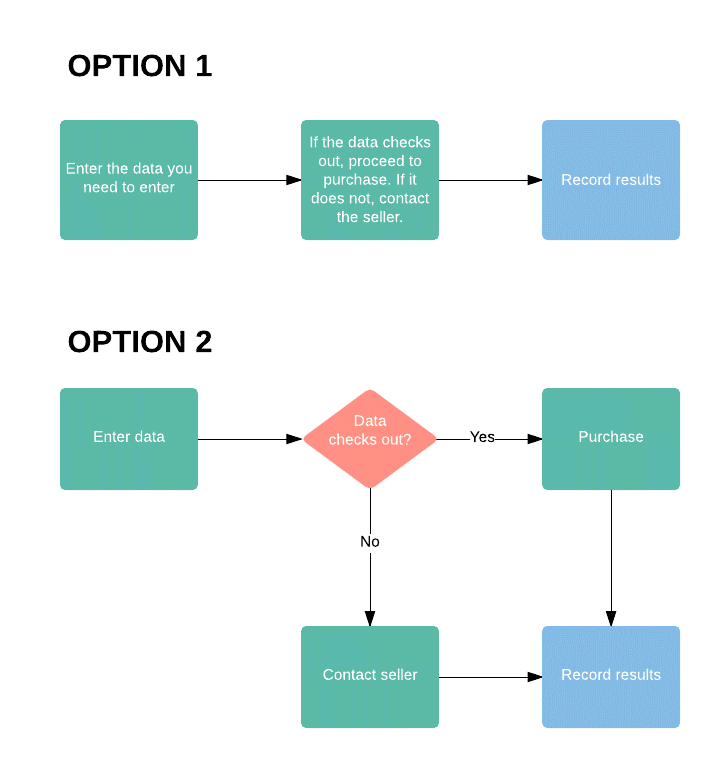
A diagram should be a visually engaging tool, not just another way to organize text. So be sure you’re avoiding overly wordy labels. The examples below illustrate these principles pretty well. Note how “Option 2” contains more shapes, but is less wordy—it lets the shapes speak for themselves.
4. Don’t be afraid to revise, then revise again
And by revise, we don’t just mean “proofread.” A diagram doesn’t have to be treated like a static document. Many of the best business diagrams can be edited at any time to reflect new changes in a process or design. If you’re diagramming online, you can revisit and update your old work whenever necessary. When you make changes, Lucidchart lets you also make sure they’re automatically reflected anywhere your diagram might be embedded, such as in Confluence. And if you need others to add to your diagram, you can invite them to collaborate directly with you.
5. Have fun
This point seems silly, but it’s true. Diagrams should simplify work for you, not make it more difficult. Have fun playing around with different tools and shapes, and make your diagram stand out with cool color choices or photos. Feel free to inject a little personality into your work, whether it’s your own, your brand’s, or a mix of both. Almost anything can be turned into a diagram—it’s time to start exploring the endless possibilities.
Ready to start diagramming? Check out the Lucidchart diagrams for Jira and Lucidchart for Confluence add-ons in the Atlassian Marketplace.